Community Corner
At a Glance: Comparing Burglary Rates Among North Allegheny Communities and Their Neighbors
See which north suburban community has the highest burglary rate when measured as a percentage of its population.

The following data is from the F.B.I Uniform Crime report for 2011:
Find out what's happening in North Alleghenywith free, real-time updates from Patch.
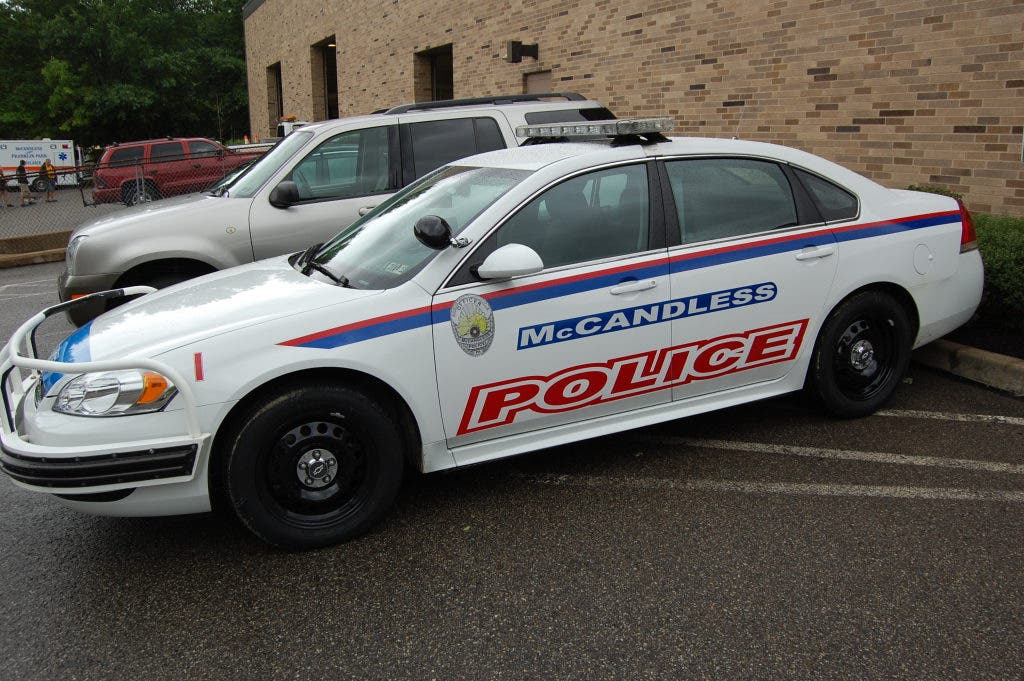
Community
Population Number of Burglaries Rate to Population Ross Township 31,204 75 .002% West View Borough 6,793 18 .003% McCandless 28,548 62 .002% Franklin Park 13,513 8 .001% Cranberry Township 28,188 44 .002% Adams Township 11,689 14 .001% Sewickley 4,388 7 .002% Hampton Township 18,422 17 .001% Leetsdale 1,222 3 .002% Moon Township 24,262 39 .002% Robinson Township 13,397 30 .002% Bellevue 8,397 37 .004% Shaler Township 28,849 71 .003% Millvale 3,756 19 .005% Etna 3,462 18 .005% City of Pittsburgh 308,609 2,686 .009% City of Philadelphia 1,530,873 12,057 .008%FBI Notation: The data used in creating this table were from all city and town law enforcement agencies submitting 12 months of complete offense data for 2011.
Find out what's happening in North Alleghenywith free, real-time updates from Patch.
Follow us on Twitter | Like us on Facebook
Check out some of today's other top stories here.
Get more local news delivered straight to your inbox. Sign up for free Patch newsletters and alerts.
We’ve removed the ability to reply as we work to make improvements. Learn more here

